We’re here to help you choose the most appropriate content types to fulfill your content strategy. In this series, we’re breaking down the most popular content types to their most basic fundamentals — simple definitions, clarity on formats, and plenty of examples — so you can start with a solid foundation.
What is an infographic?
As a hybrid of “information” and “graphics,” the infographic is a visual communication device that tells a complex story graphically using designs, images and a minimal amount of copy.
Why produce an infographic?
A great infographic doesn’t just communicate a complex concept uniquely, but the best make you want to share it with others because they’re creative and jam-packed with practical info.
It may begin on a data sheet, but thanks to the work of a writer and graphic designer, a compelling flow can be created that keeps eyeballs affixed as they move down the page.
Sure, you could serve up data with old-fashioned bullet points, relying on percentage signs, decimals and pie charts to tell your story. But you probably shouldn’t unless your goal is to put people to sleep.

The long and short of it
Here’s a quick breakdown of how to think about infographic lengths (with examples):
- Short Form
- 1-3 sections
- 2-4 larger graphics or charts
-
Standard
- 3-5 sections
- 5-9 larger graphics
- Long Form
- 5+ sections
- 9+ larger graphics or charts
Beyond length, here are three popular thematic types of infographics:
- Data visualization: Big data is huge, so representing statistics in this fashion is an aesthetically pleasing way to dish out data and analysis in an easy-to-devour fashion.
- Information design: This type can cover everything from how a process works to chronological timelines to anything dealing with concepts (instead of data).
- Editorial/news-driven: Most magazines and newspapers have digital editions that meet or surpass print nowadays, so tackling a timely topic — or working with publishers to tell these stories in a branded content play could make sense, depending on your story.
Businesses that could use infographics include…
Any business that wants to distill complex information (data, original research, and/or studies) into a digestible and shareable communication device might consider an infographic.
Infographic examples – short form
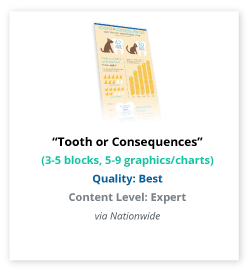
Infographic examples – standard form
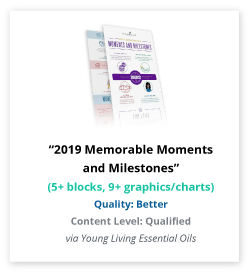
Infographic examples – long form
![]()
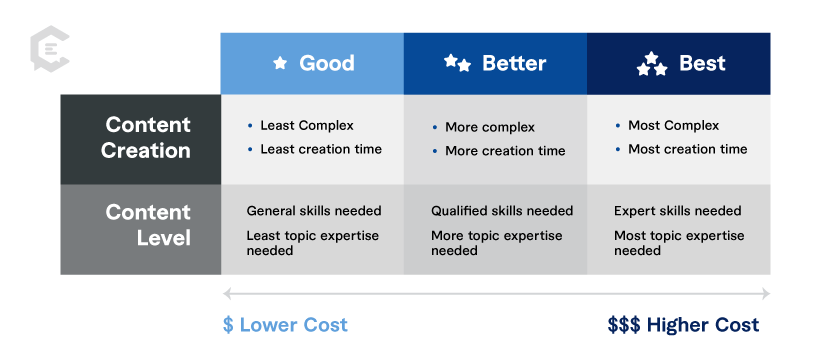
Understanding content quality in examples
Our team has rated content type examples in three degrees of quality (Good, Better, Best) to help you better gauge resources needed for your content plan. In general, the degrees of content quality correspond to our three content levels (General, Qualified, Expert) based on the criteria below. Please consider there are multiple variables that could determine the cost, completion time, or content level for any content piece with a perceived degree of quality.
More content types with examples:
- What Is an Article?
- What Is an Ebook?
- What Is a White Paper?
- What Is Email Content?
- What Is a Customer Story?
- What Is a Product Description?
- What Is a Presentation?
- What Is a Motion Graphic?
- What Is an Animated Video?
Need help creating engaging content for infographics? Talk to a content specialist at ClearVoice about getting content created for your brand today.