Whether it was the crazy sideline catches, Melissa McCarthy dodging whales, or the 31-point rally comeback that gave the Patriots the epic win, Super Bowl LI (51) had something to please all audiences.
As a true marketer, though, a big part of the reason you were watching was for the commercials, right?
Or, are you a super geeky marketer where the main reason you were watching was for the consumer analytics?
Huh? Consumer analytics in the Super Bowl?
That’s right. The geekiest of geeky marketers had one eye watching the game and the other one on their laptops and analytics data. On the field were a slew of technological wonders, such as the Intel 360-degree video playbacks that made the best plays look like they came from a super high-def video game. Off the field were well-paid consumer analytics firms, tracking everything from stadium attendee Wi-Fi usage patterns to social media sentiment toward the ultra-expensive commercials.
Super Bowl consumer analytics
Having an understanding of the creative ways in which consumers are being tracked and analyzed during the Super Bowl provides marketing professionals with extra insight into how they can, in their own companies, improve their use of analytics to generate more revenue.
While analysts and marketing firms haven’t yet published their findings on Super Bowl LI consumer analytics, we can look at findings from the past two years to see what we might leverage in our own marketing pursuits:
Networked insights
- Interesting insight: Networked Insights used natural language classification to detect nearly 50 different emotions being expressed by consumers in their social media posts. Their analysis of 2015 Super Bowl commercials showed that the #WinAtGlue Loctite commercial had the greatest increase in positive social media interactions — 250 times the positive daily social response.
- Valuable takeaway: From their research into Nationwide’s 2015 Super Bowl ad that generated widespread backlash because of the negativity of the message, they saw that Nationwide still enjoyed some short-term gains in brand health, simply from current customers going online to defend the company on the negative social posts.
Extreme Networks
- Interesting insight: 25 percent of the in-stadium fans at Super Bowl 2015 connected their mobile device to the stadium’s Wi-Fi during the game. That represents a 56 percent increase year over year, with just 16 percent connecting in 2014.
- Valuable takeaway: Extreme Networks shared that “Insight into how and when your customers are most active and available for engagement, as well their favorite apps and media is critical for tuning your marketing plan as well as maximizing customer satisfaction.”
Forrester Research
- Interesting insight: From Forrester research of 879 smartphone owners we learn that while mobile app usage during the Super Bowl is similar to other days, there are spikes to sports, food/drink, reference, health/wellness and shopping websites and apps.
- Valuable takeaway: From this research, Forrester encouraged marketers to give viewers more opportunities for brand engagement through such things as coupons/limited-time offers, mobile games and microsites containing additional information.
Leveraging analytics in your own marketing
I’ve taken a page out of the playbook of Super Bowl analytics and put some creative and advanced analytics to work for my own employer. The salespeople at my company are each completing dozens of RFPs during the year, in an effort to win large software contracts with institutions of higher education.
Just as some smart individuals sat down and brainstormed ideas on how they could track and benefit from Wi-Fi-usage patterns of Super Bowl attendees, I sat down with my sales team and inquired, “What pain points do you currently have with the RFP completion process?” Each of them answered similarly, saying, “Once we send the digital RFPs out, we have no idea what is happening with them.”
Our salespeople were frustrated by the lack of visibility once they sent the RFPs off. Other than receiving a confirmation that the RFPs had been received, oftentimes they would receive no further information from the universities until the contract was either awarded or denied.
As we brainstormed ideas, I continued to evaluate ways in which analytics could benefit their process. Eventually, we settled on an advanced analytics technique that I was confident I could get to work. Our salespeople often include links to short product demo videos within the RFPs. Working with my sales team — mostly for feedback and testing — I was able to put together an automated tracking, analysis and reporting process where the salespeople would be alerted each time a given university watched one of the videos from an RFP link.
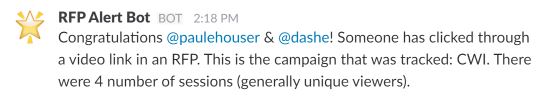
How did I set up the Slack alerts?
Techsmith (who we use) and many other paid video hosting platforms allow you to place your Google Analytics (GA) code on your video view pages. Here’s how I did it:
- I set our salespeople up with the Google Campaign URL Builder and had them start tagging their video links
- Then, I created a report in GA to watch for any clicks through to those videos
- I then integrated GA with a Google Sheet through the GA Add-on, and I set up the GA Add-on to run itself regularly
- I then integrated the Google Sheet with our chat tool, Slack, through a pre-built Zapier Zapbook
Voilà — every time a prospective customer visited a tagged video URL, our salespeople would get an alert like the one above.
While the above integration may sound difficult, it took fewer than three hours to set up and has been a great process improvement (it’s also earned me repeated public praise from my CEO and other executives). If you would like to set up something similar and have questions, feel free to put them in the comments below and I’ll help you out.